
Analytics & Performance
Track conversion funnels, attributed bundle revenue, customer drop-off points, and top-selling offers.
The Analytics Dashboard in ComboKit provides transparent, real-time insights into your bundle promotions. Monitor the complete buyer journey from initial storefront impression to checkout completion, compare revenue across different bundle types, and pinpoint top-performing offers.
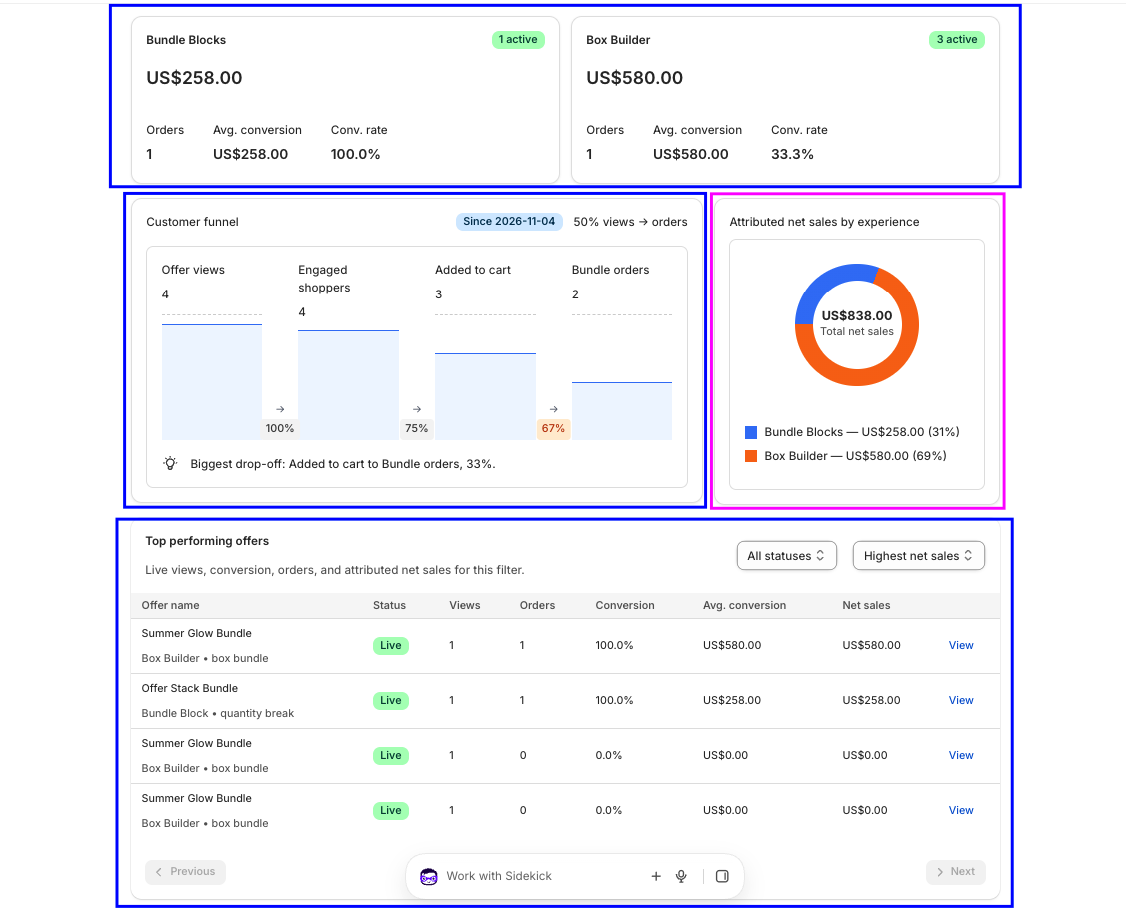
Date Range & Funnel Metrics
Filter performance data across 8 flexible reporting periods (Today, Yesterday, Last 7 days, Last 30 days, Last 3 months, etc.). The Customer Funnel tracks shoppers across 4 stages to highlight conversion rates and drop-off points:
- 1. Bundle Views (Impressions): Total times shoppers loaded product pages featuring active bundle widgets.
- 2. Added to Cart: Customers who selected a bundle tier or built a box and clicked 'Add to Cart'.
- 3. Reached Checkout: Shoppers who proceeded into Shopify checkout with bundled items.
- 4. Orders Completed: Successfully placed and paid orders containing bundle lines.
Revenue by Experience & Top Offers
- Revenue by Experience: Visual breakdown comparing attributed revenue between inline Bundle Blocks (volume tiers, kits, add-ons) and custom Box Builders.
- Top Performing Offers: Leaderboard ranking active bundles by highest revenue, total order volume, and views so you can easily scale high-converting promotions.
- Drop-off Optimization: If drop-off is high at Add to Cart, test bolder savings badges or countdown timers; if drop-off is at cart, enable direct-to-checkout in bundle settings.